Verify the plugin after deployment
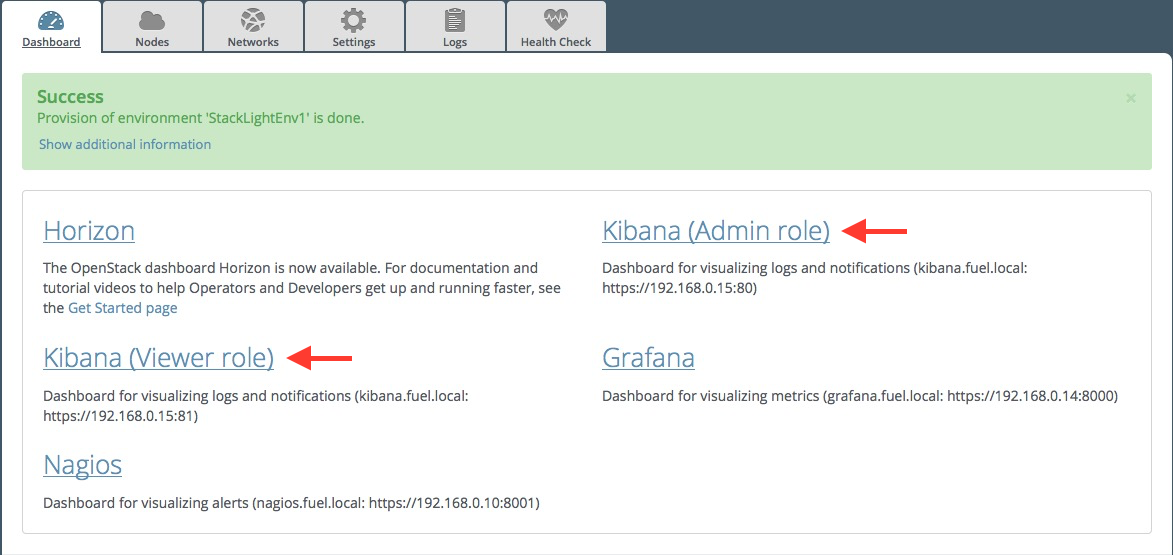
Depending on the number of nodes and deployment setup, deploying a Mirantis OpenStack environment can typically take from 20 minutes to several hours. But once your deployment is complete, you should see a deployment success notification message with two links to Kibana as shown in the picture below:
Note
Two different ports are created to enforce the access authorization to Kibana:
- One port (80) for users with the admin role
- One port (81) for users with the viewer role.
If Kibana is installed on the management network, you may not have direct access to the Kibana web UI. Some extra network configuration may be required to create an SSH tunnel to the management network.
Verifying Elasticsearch
To verify that the Elasticsearch cluster is running properly, first retrieve the Elasticsearch cluster virtual IP address:
On the Fuel Master node, find the IP address of a node where the Elasticsearch server is installed using the fuel nodes command:
[root@fuel ~]# fuel nodes
id|status|name            |cluster|ip  |mac |roles               |
--|------|----------------|-------|----|-------------------------|
1 |ready |Untitled (fa:87)| 1     |... |... |elasticsearch_kibana|
2 |ready |Untitled (12:aa)| 1     |... |... |elasticsearch_kibana|
3 |ready |Untitled (4e:6e)| 1     |... |... |elasticsearch_kibana|
Log in to any of these nodes using SSH, for example, to
node-1.Run the following command:
root@node-1:~# hiera lma::elasticsearch::vip
10.109.1.5
Where
10.109.1.5is the virtual IP address of your Elasticsearch cluster.With that virtual IP address, run the following command:
curl http://10.109.1.5:9200/The output should look as follows:
{
  "status" : 200,
  "name" : "node-3.test.domain.local_es-01",
  "cluster_name" : "lma",
  "version" : {
    "number" : "1.7.4",
    "build_hash" : "0d3159b9fc8bc8e367c5c40c09c2a57c0032b32e",
    "build_timestamp" : "2015-12-15T11:25:18Z",
    "build_snapshot" : false,
    "lucene_version" : "4.10.4"
  },
  "tagline" : "You Know, for Search"
}
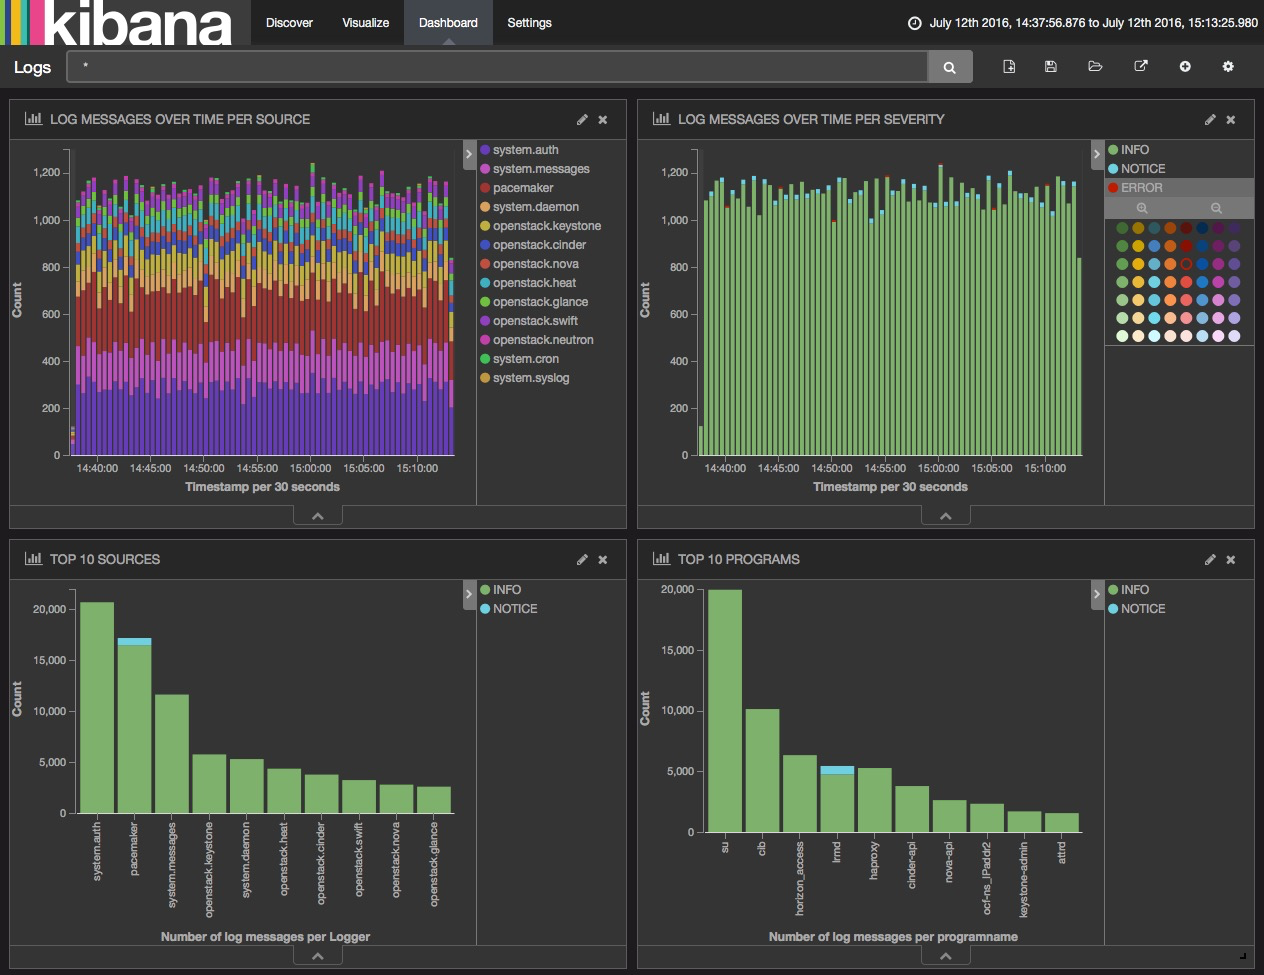
Verifying Kibana
To verify the Kibana Dashboard:
Log in to the Fuel web UI.
Click on the Kibana (Admin role) link. If your DNS is not setup, enter the IP address and the port number.
Enter your credentials.
You should be redirected to the Kibana Logs Anaytics Dashboard with four logs’ sections as follows: